Appointments Duration
Introduction & Background
In order to estimate future staffing requirements and demand in the SNEE footprint, it is important to understand how much demand (in time) is used for each appointment.
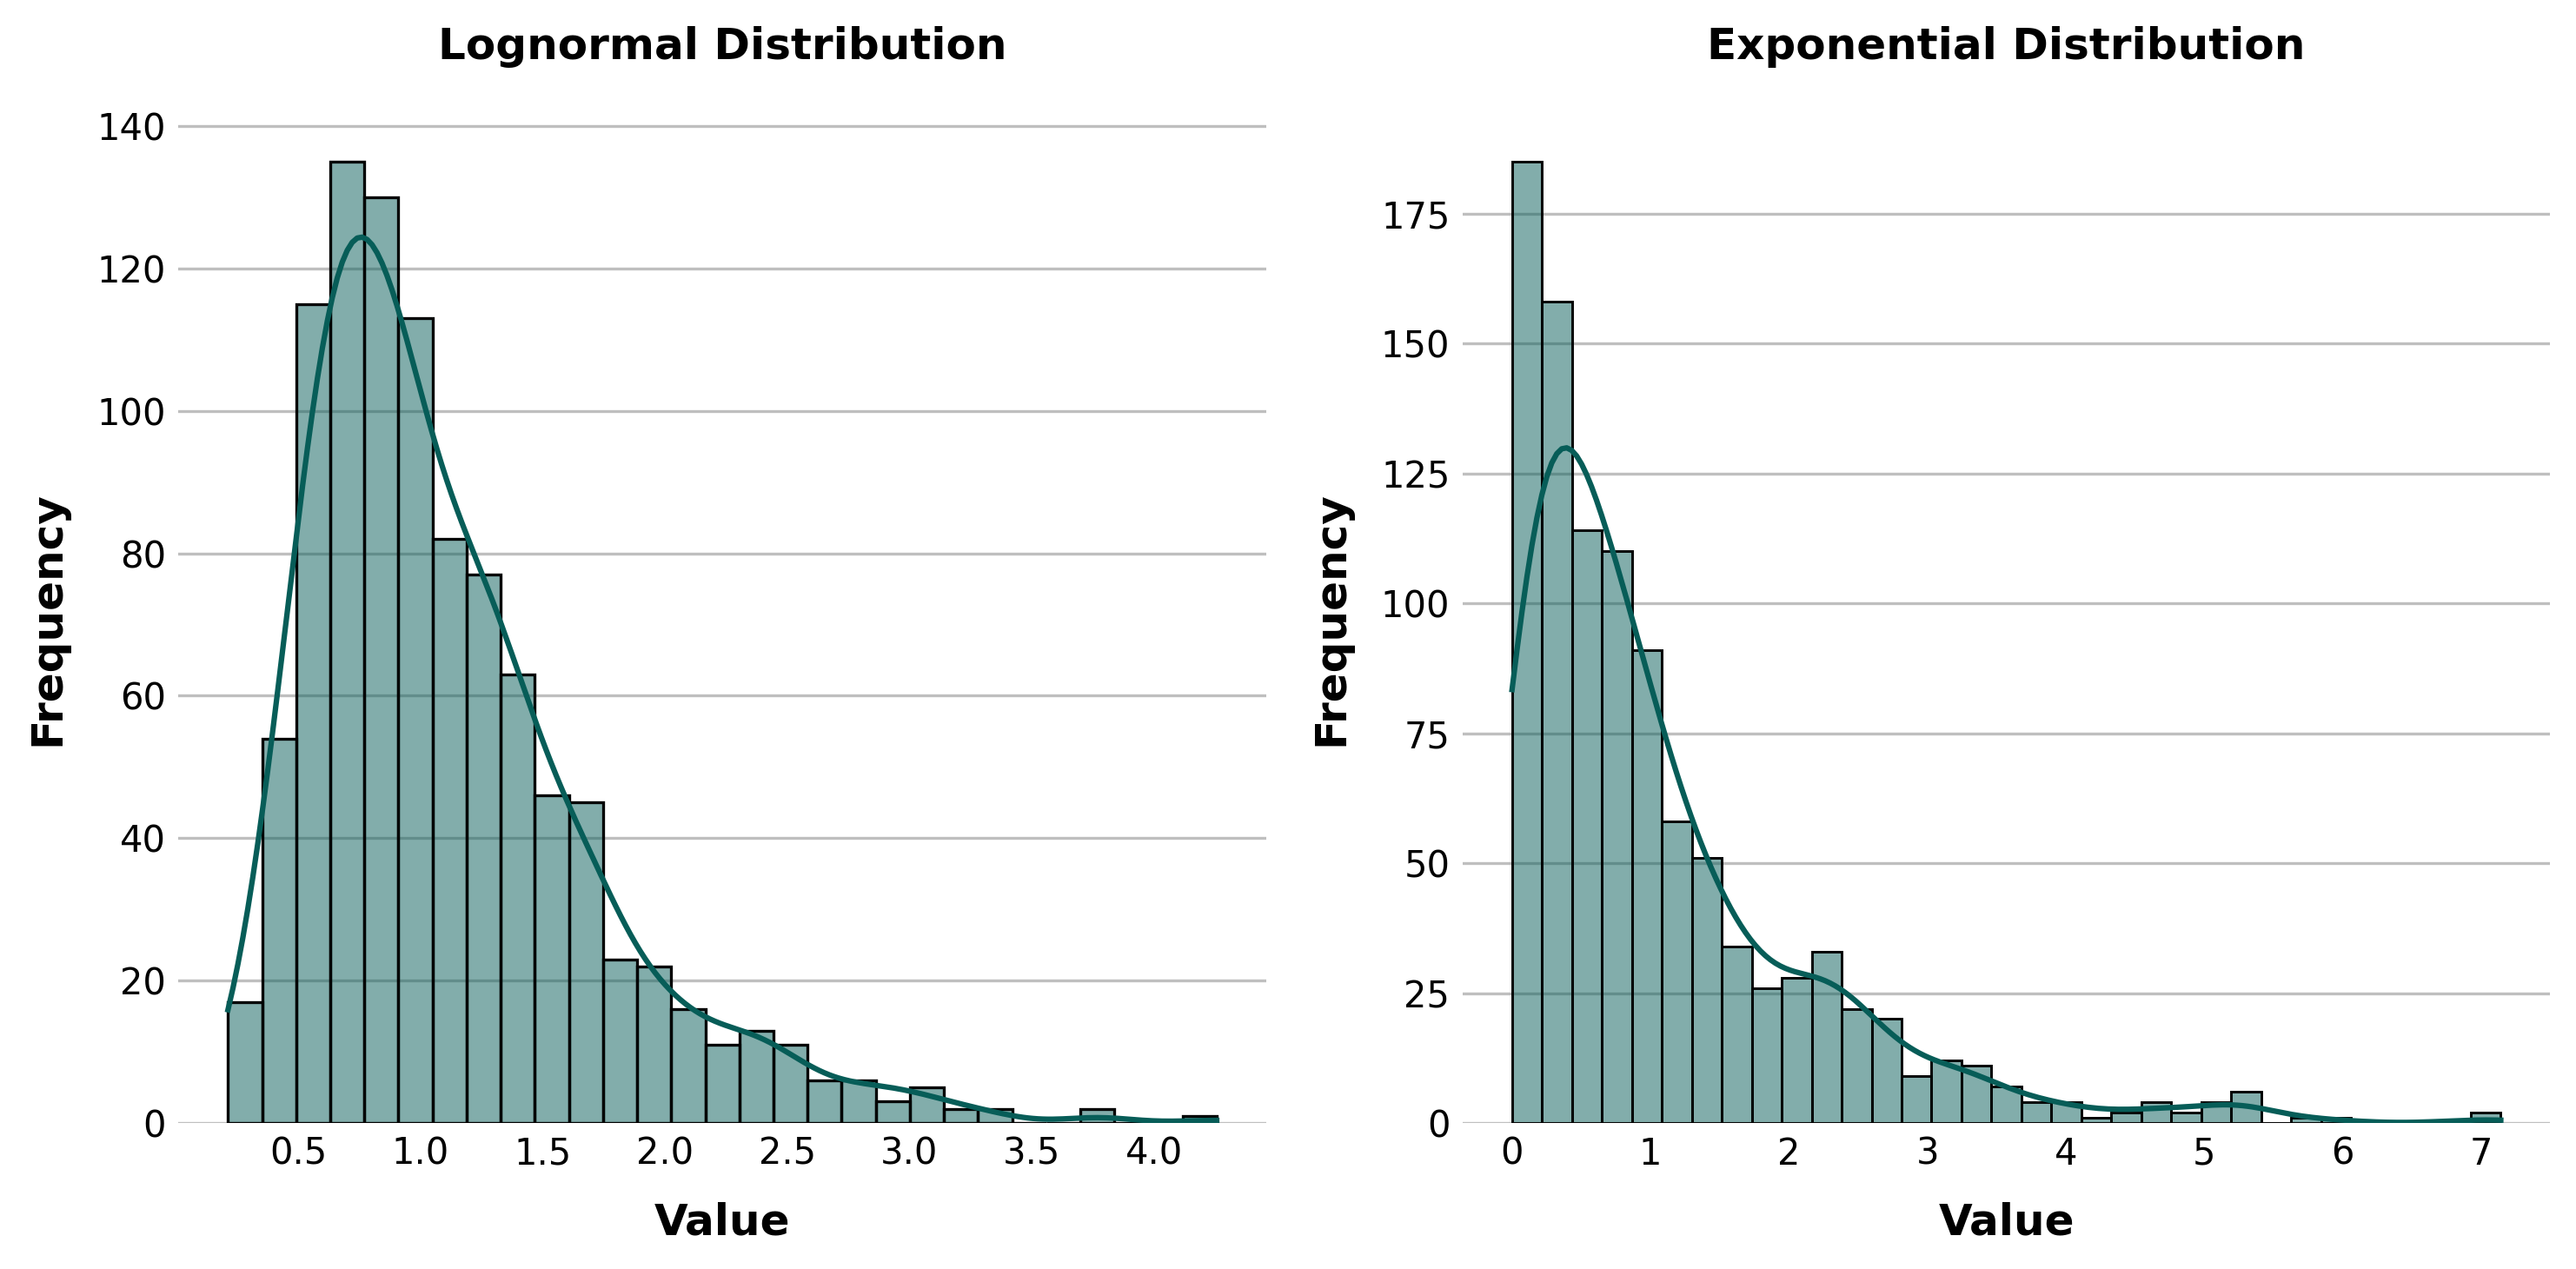
Unfortunately, the exact time taken per appointment is not provided; so it is very difficult to perform analyses to produce summary statistics or useful insights that would be possible with record-level data. With this binned data, we can still use maximum likelihood estimation (MLE) to determine the parameters of a probability distribution which can be used in further modelling of appointment times.
In this analysis we fit two empirical/theoretical distributions to the data in each sub-icb location for use in the system dynamics/ discrete event simulation analysis, the exponential distribution and a lognormal distribution. We use two, so that we can decide later on after discussion with stakeholders, which is more suitable for the model. We could also choose another distribution type.
Data Sources
The primary data for this analysis is derived from the extensive appointments dataset provided by NHS England, spanning from March 2022 to August 2024. While FY22 and FY23 were based on complete annual data, the assessment for FY24 is limited to the available data from April to August.
| Dataset used | Website URL | Download zip |
|---|---|---|
| Appointments dataset | NHS Digital - Appointments in General Practice | Regional CSV SuffolkNEEssex (Mar22 - Aug24) |
Methodology
After cleaning the data, we aggregated and counted the number of appointments in each time bin in each sub-ICB area as shown by the plots below. This was also grouped by financial year, to determine if there are any patterns or trends in the data. The distribution of the data is shown below, with the bin sizes reflective of how the data is provided.
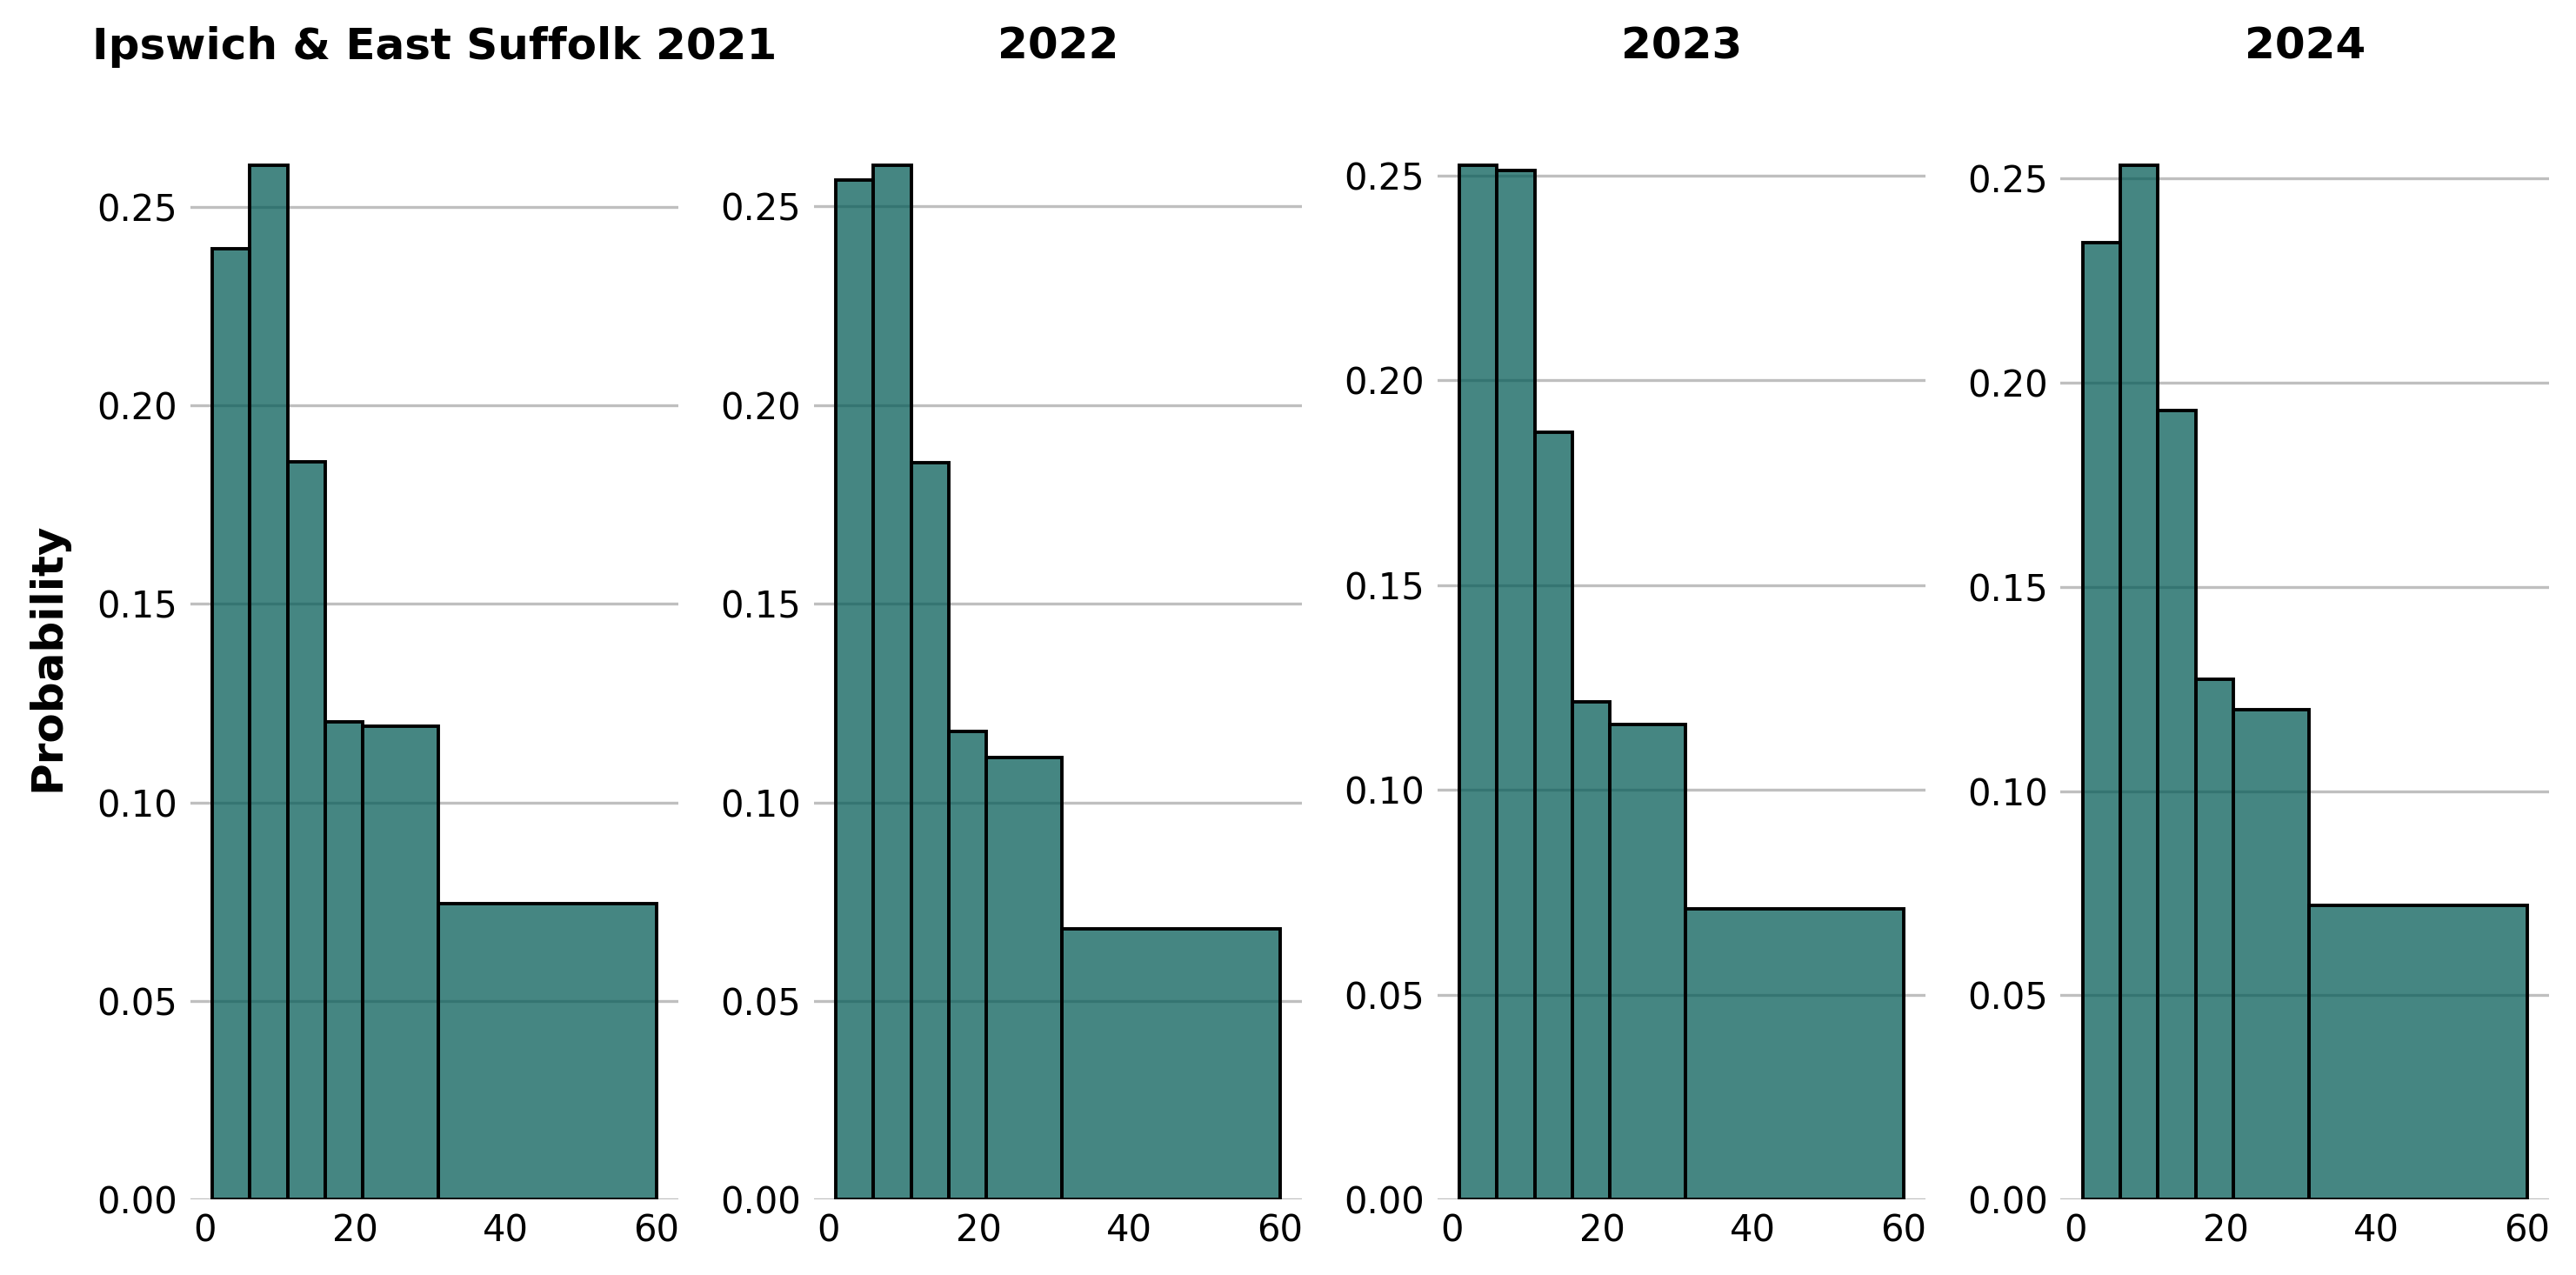
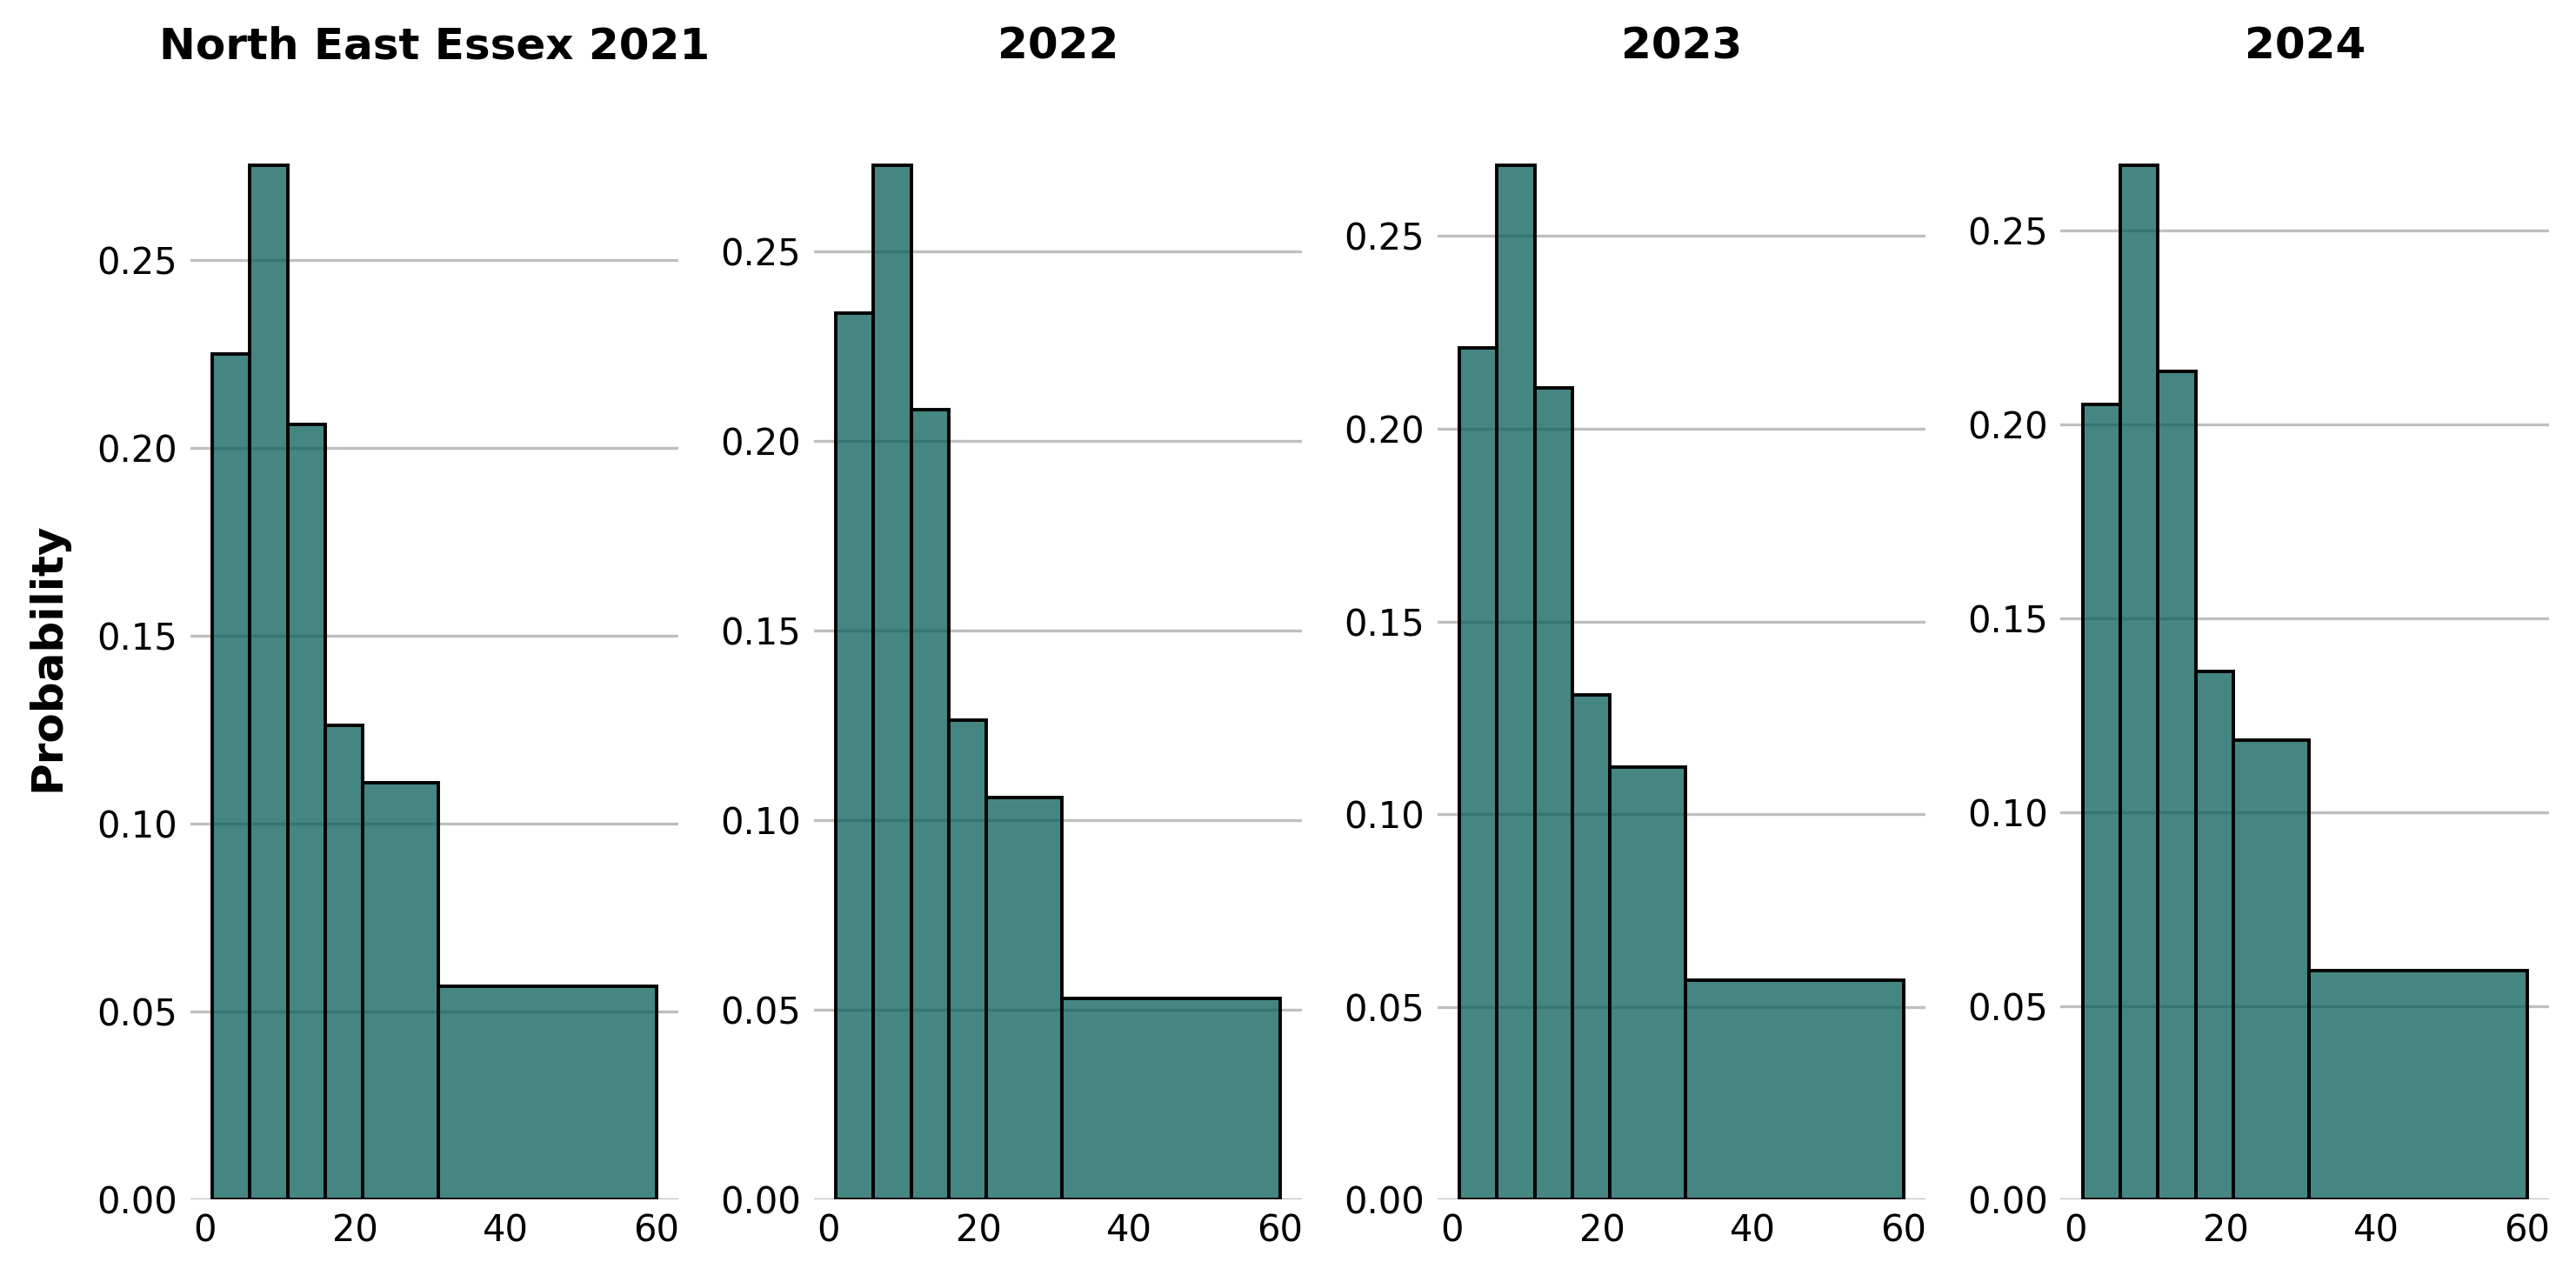
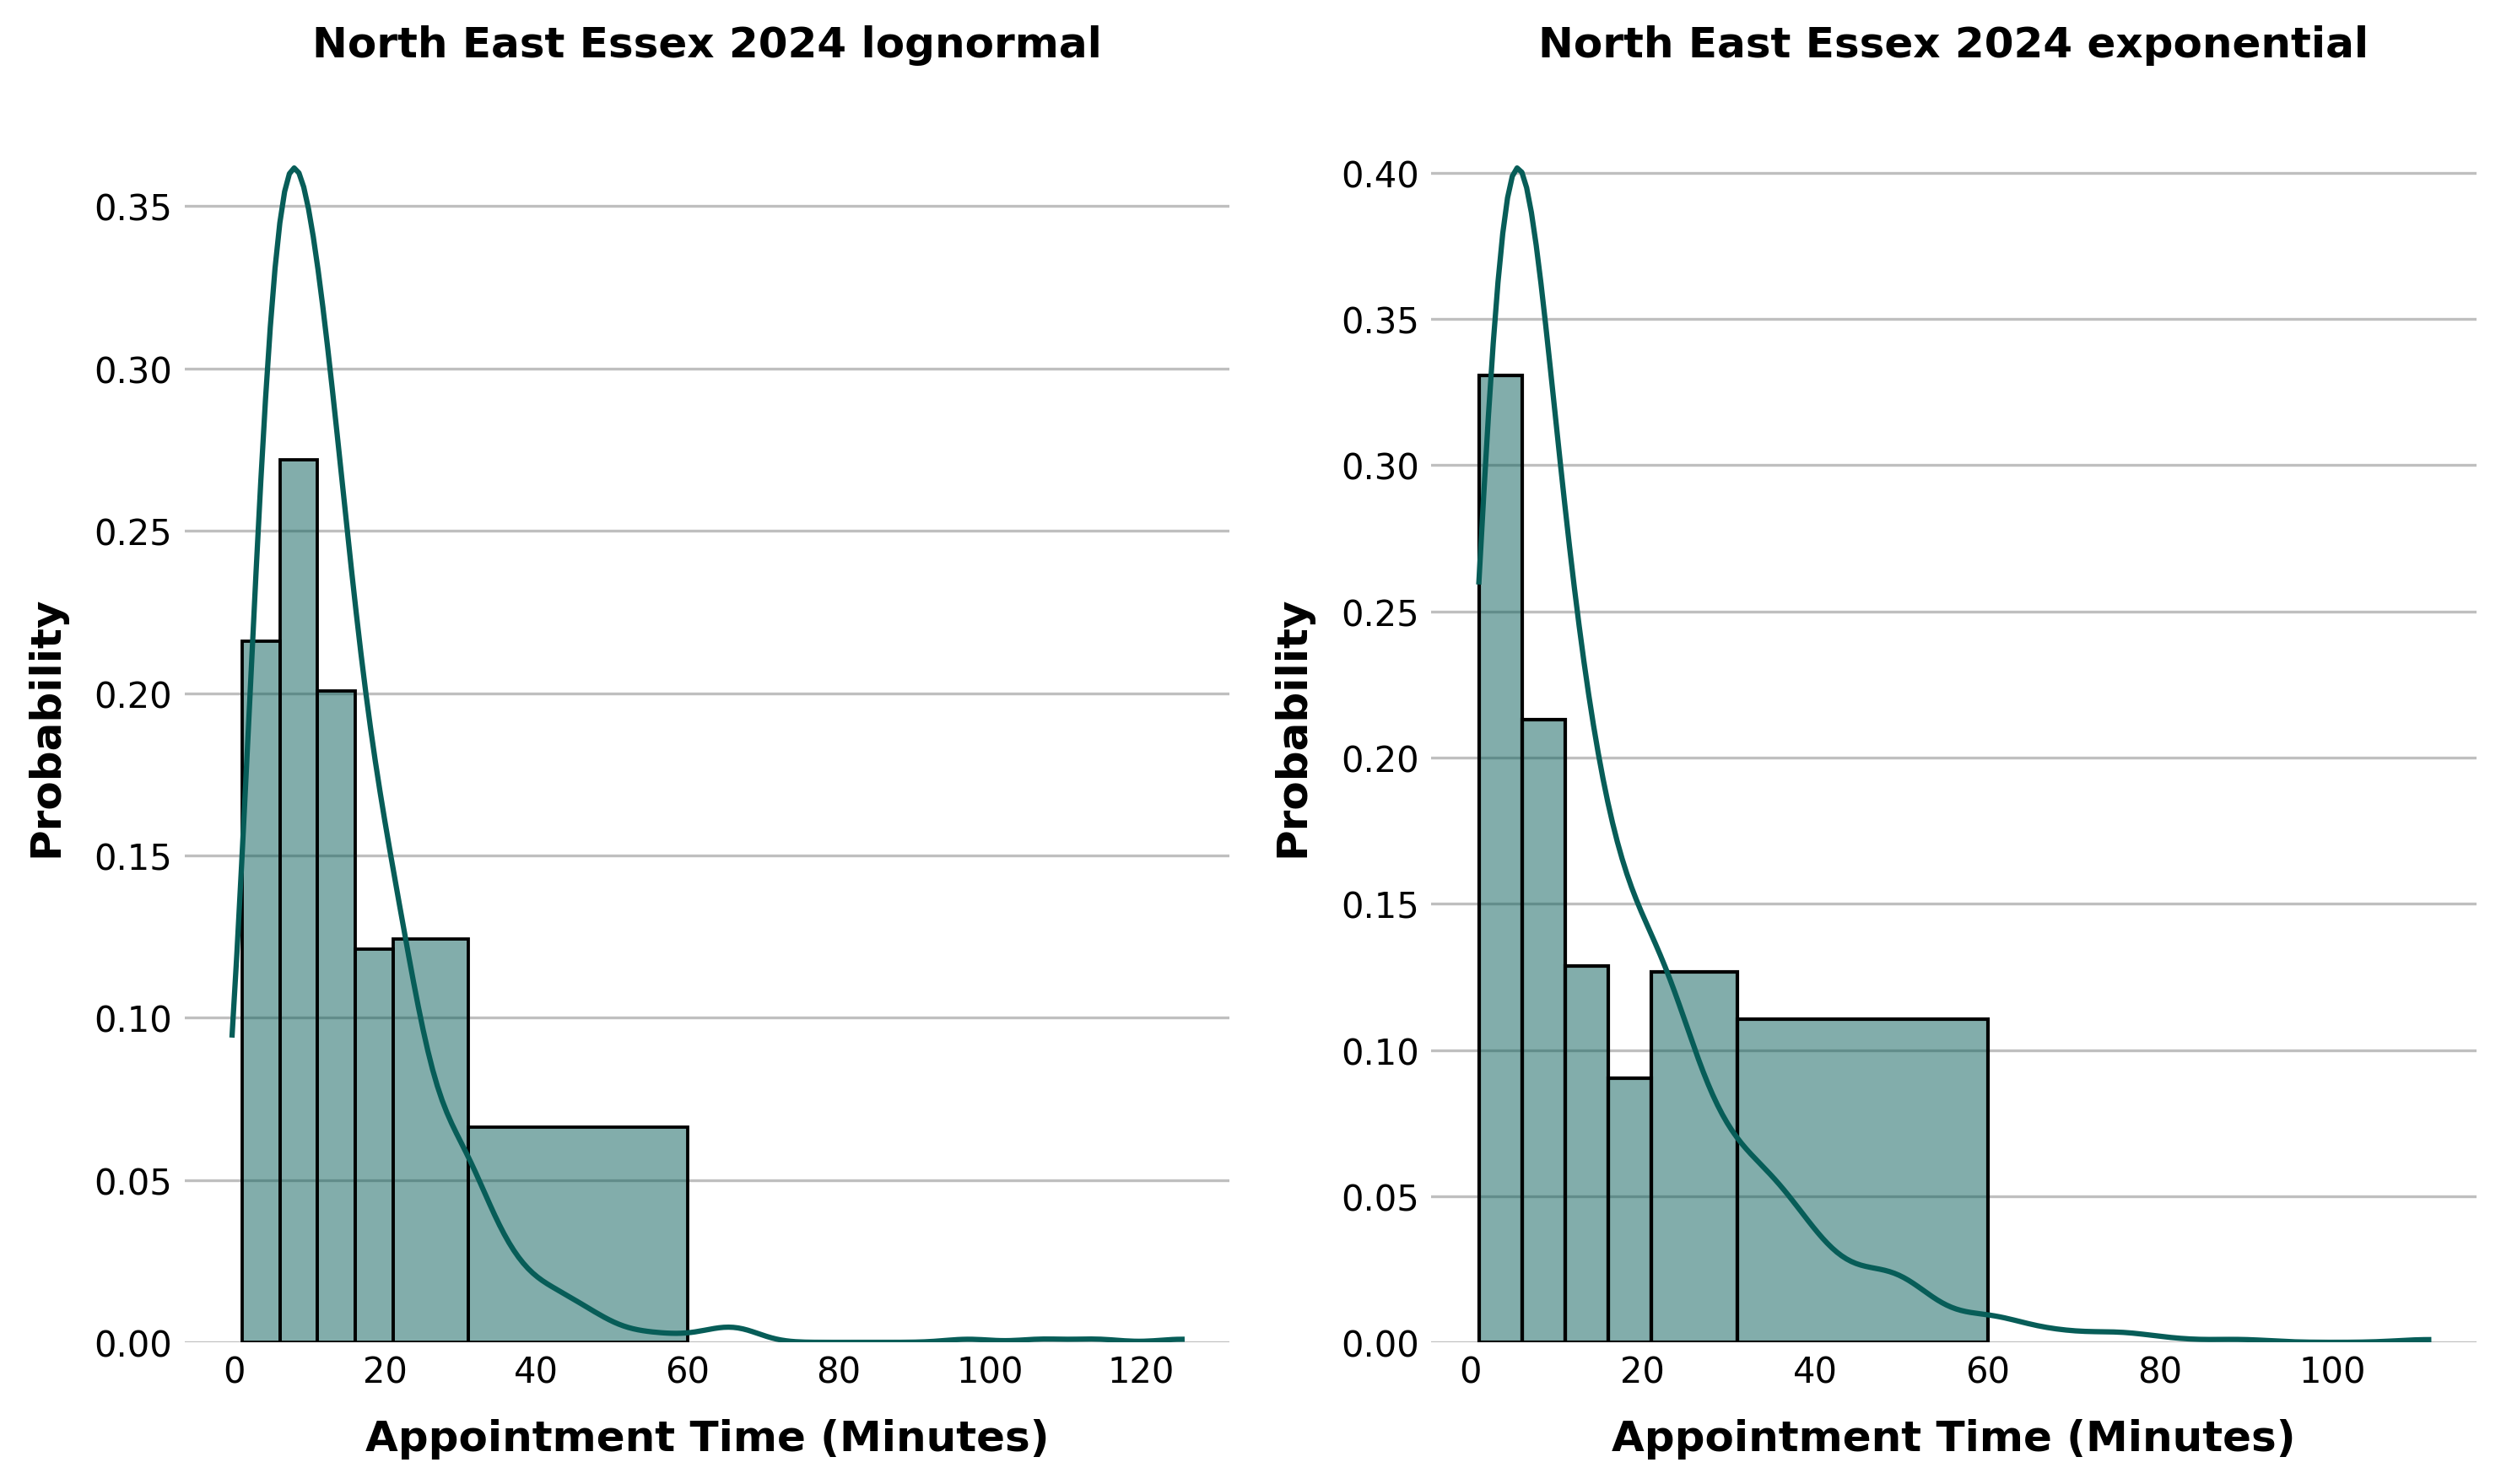
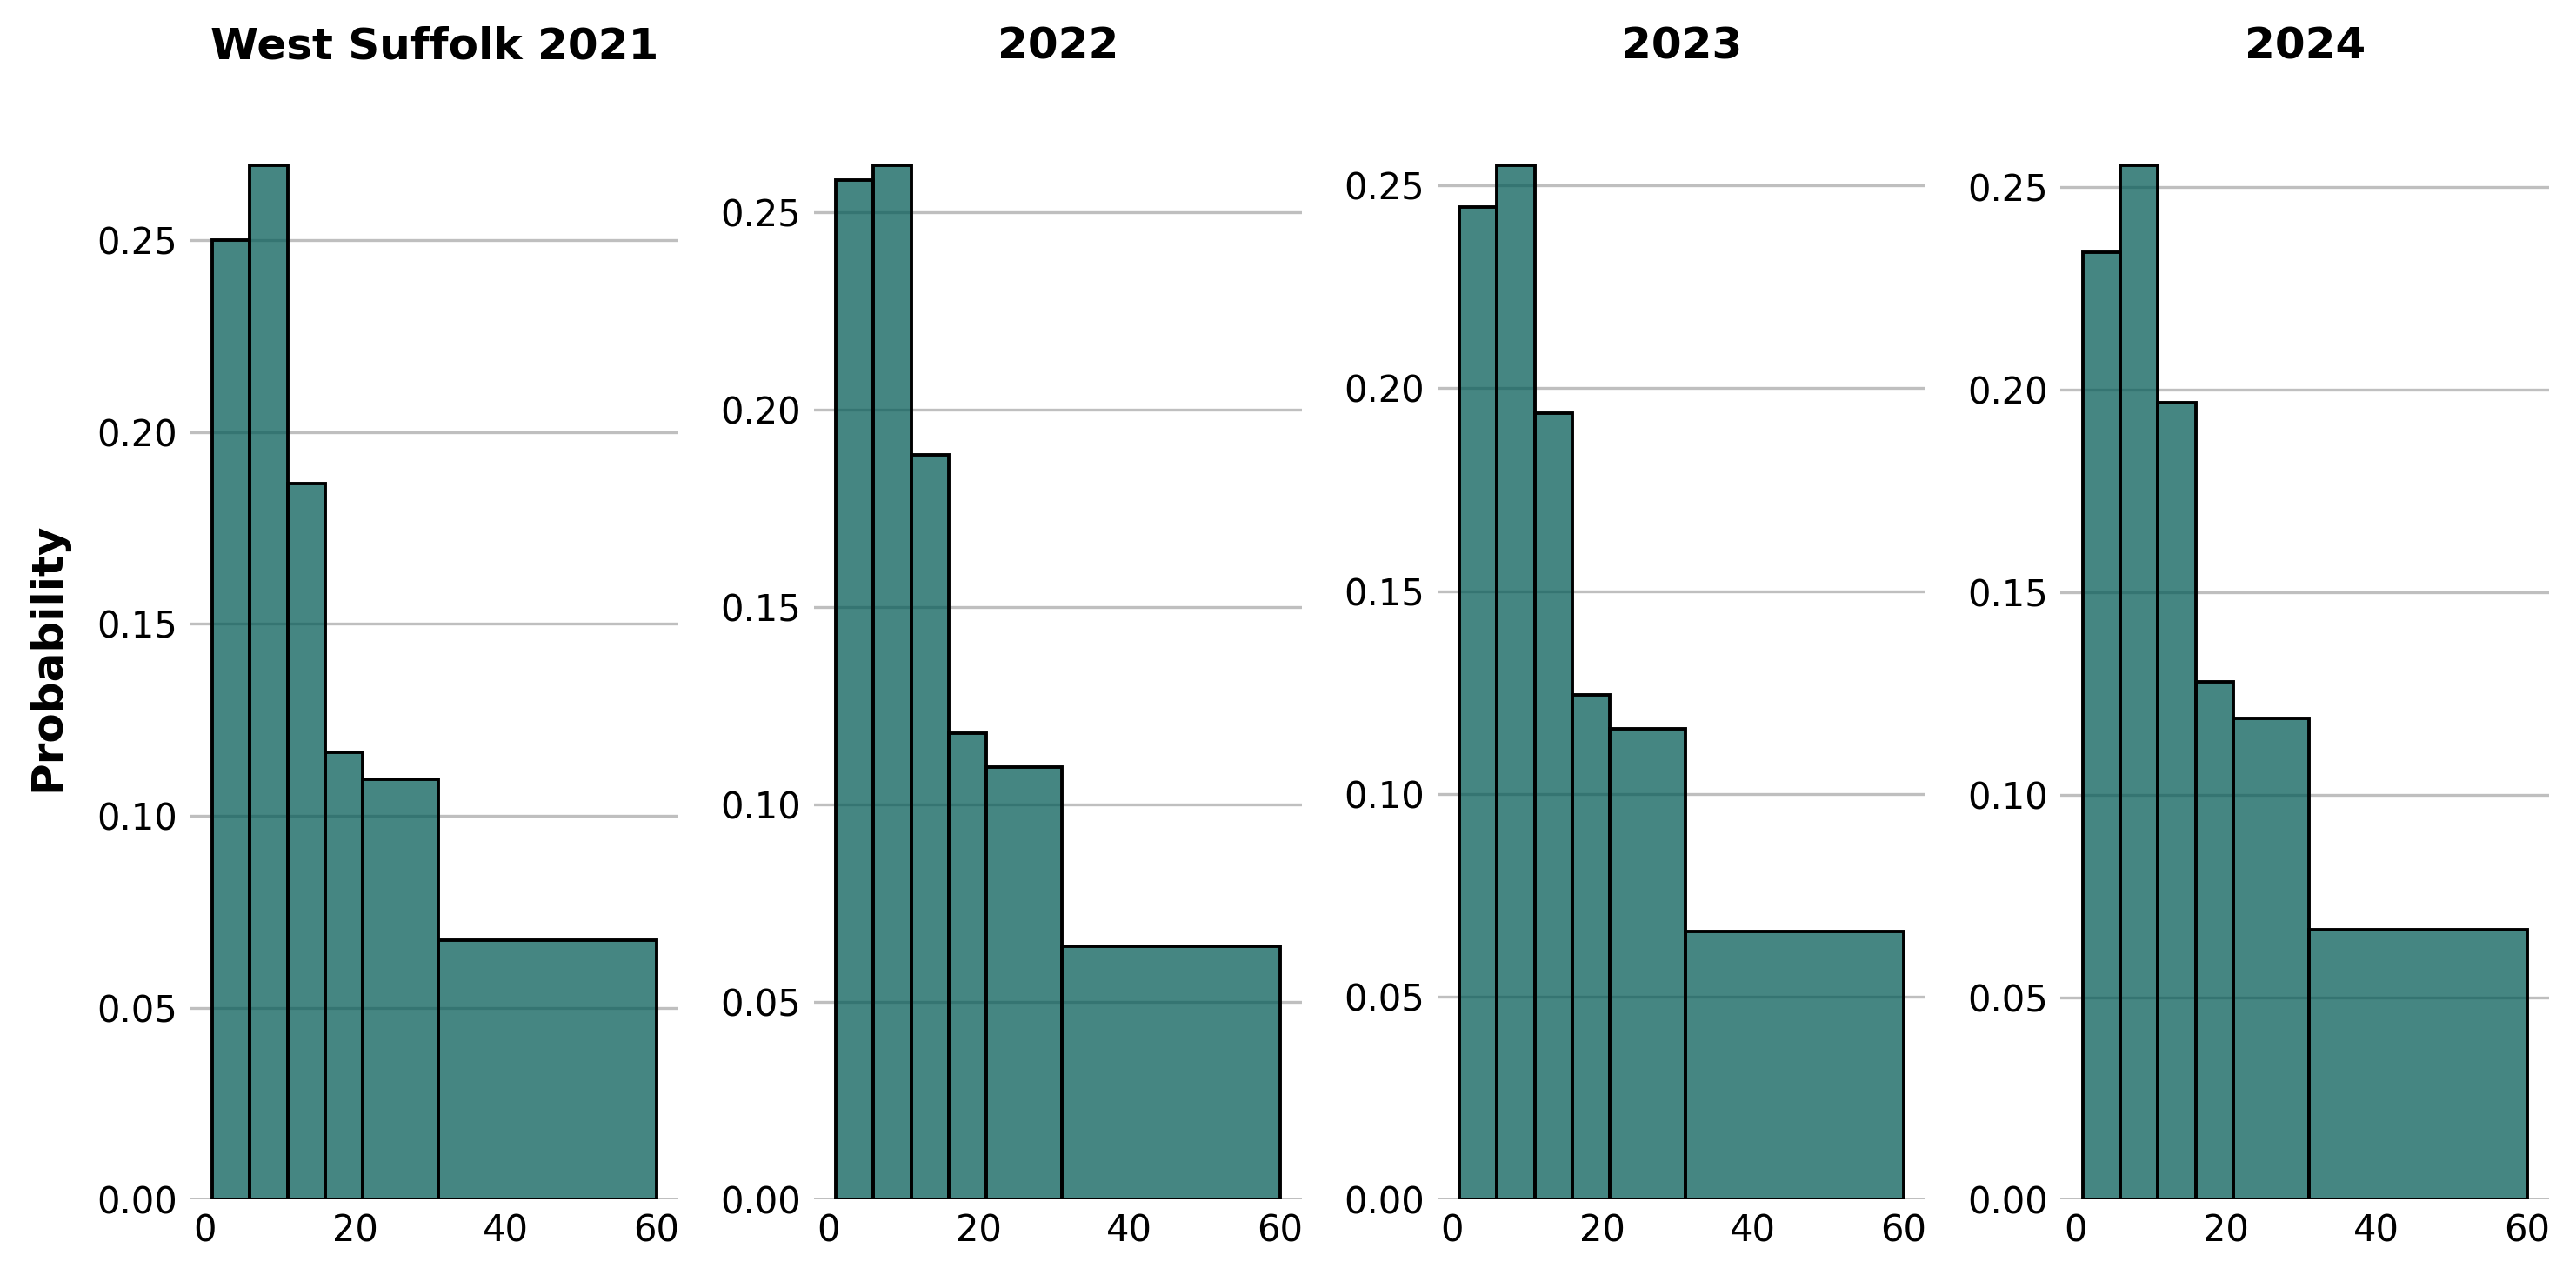
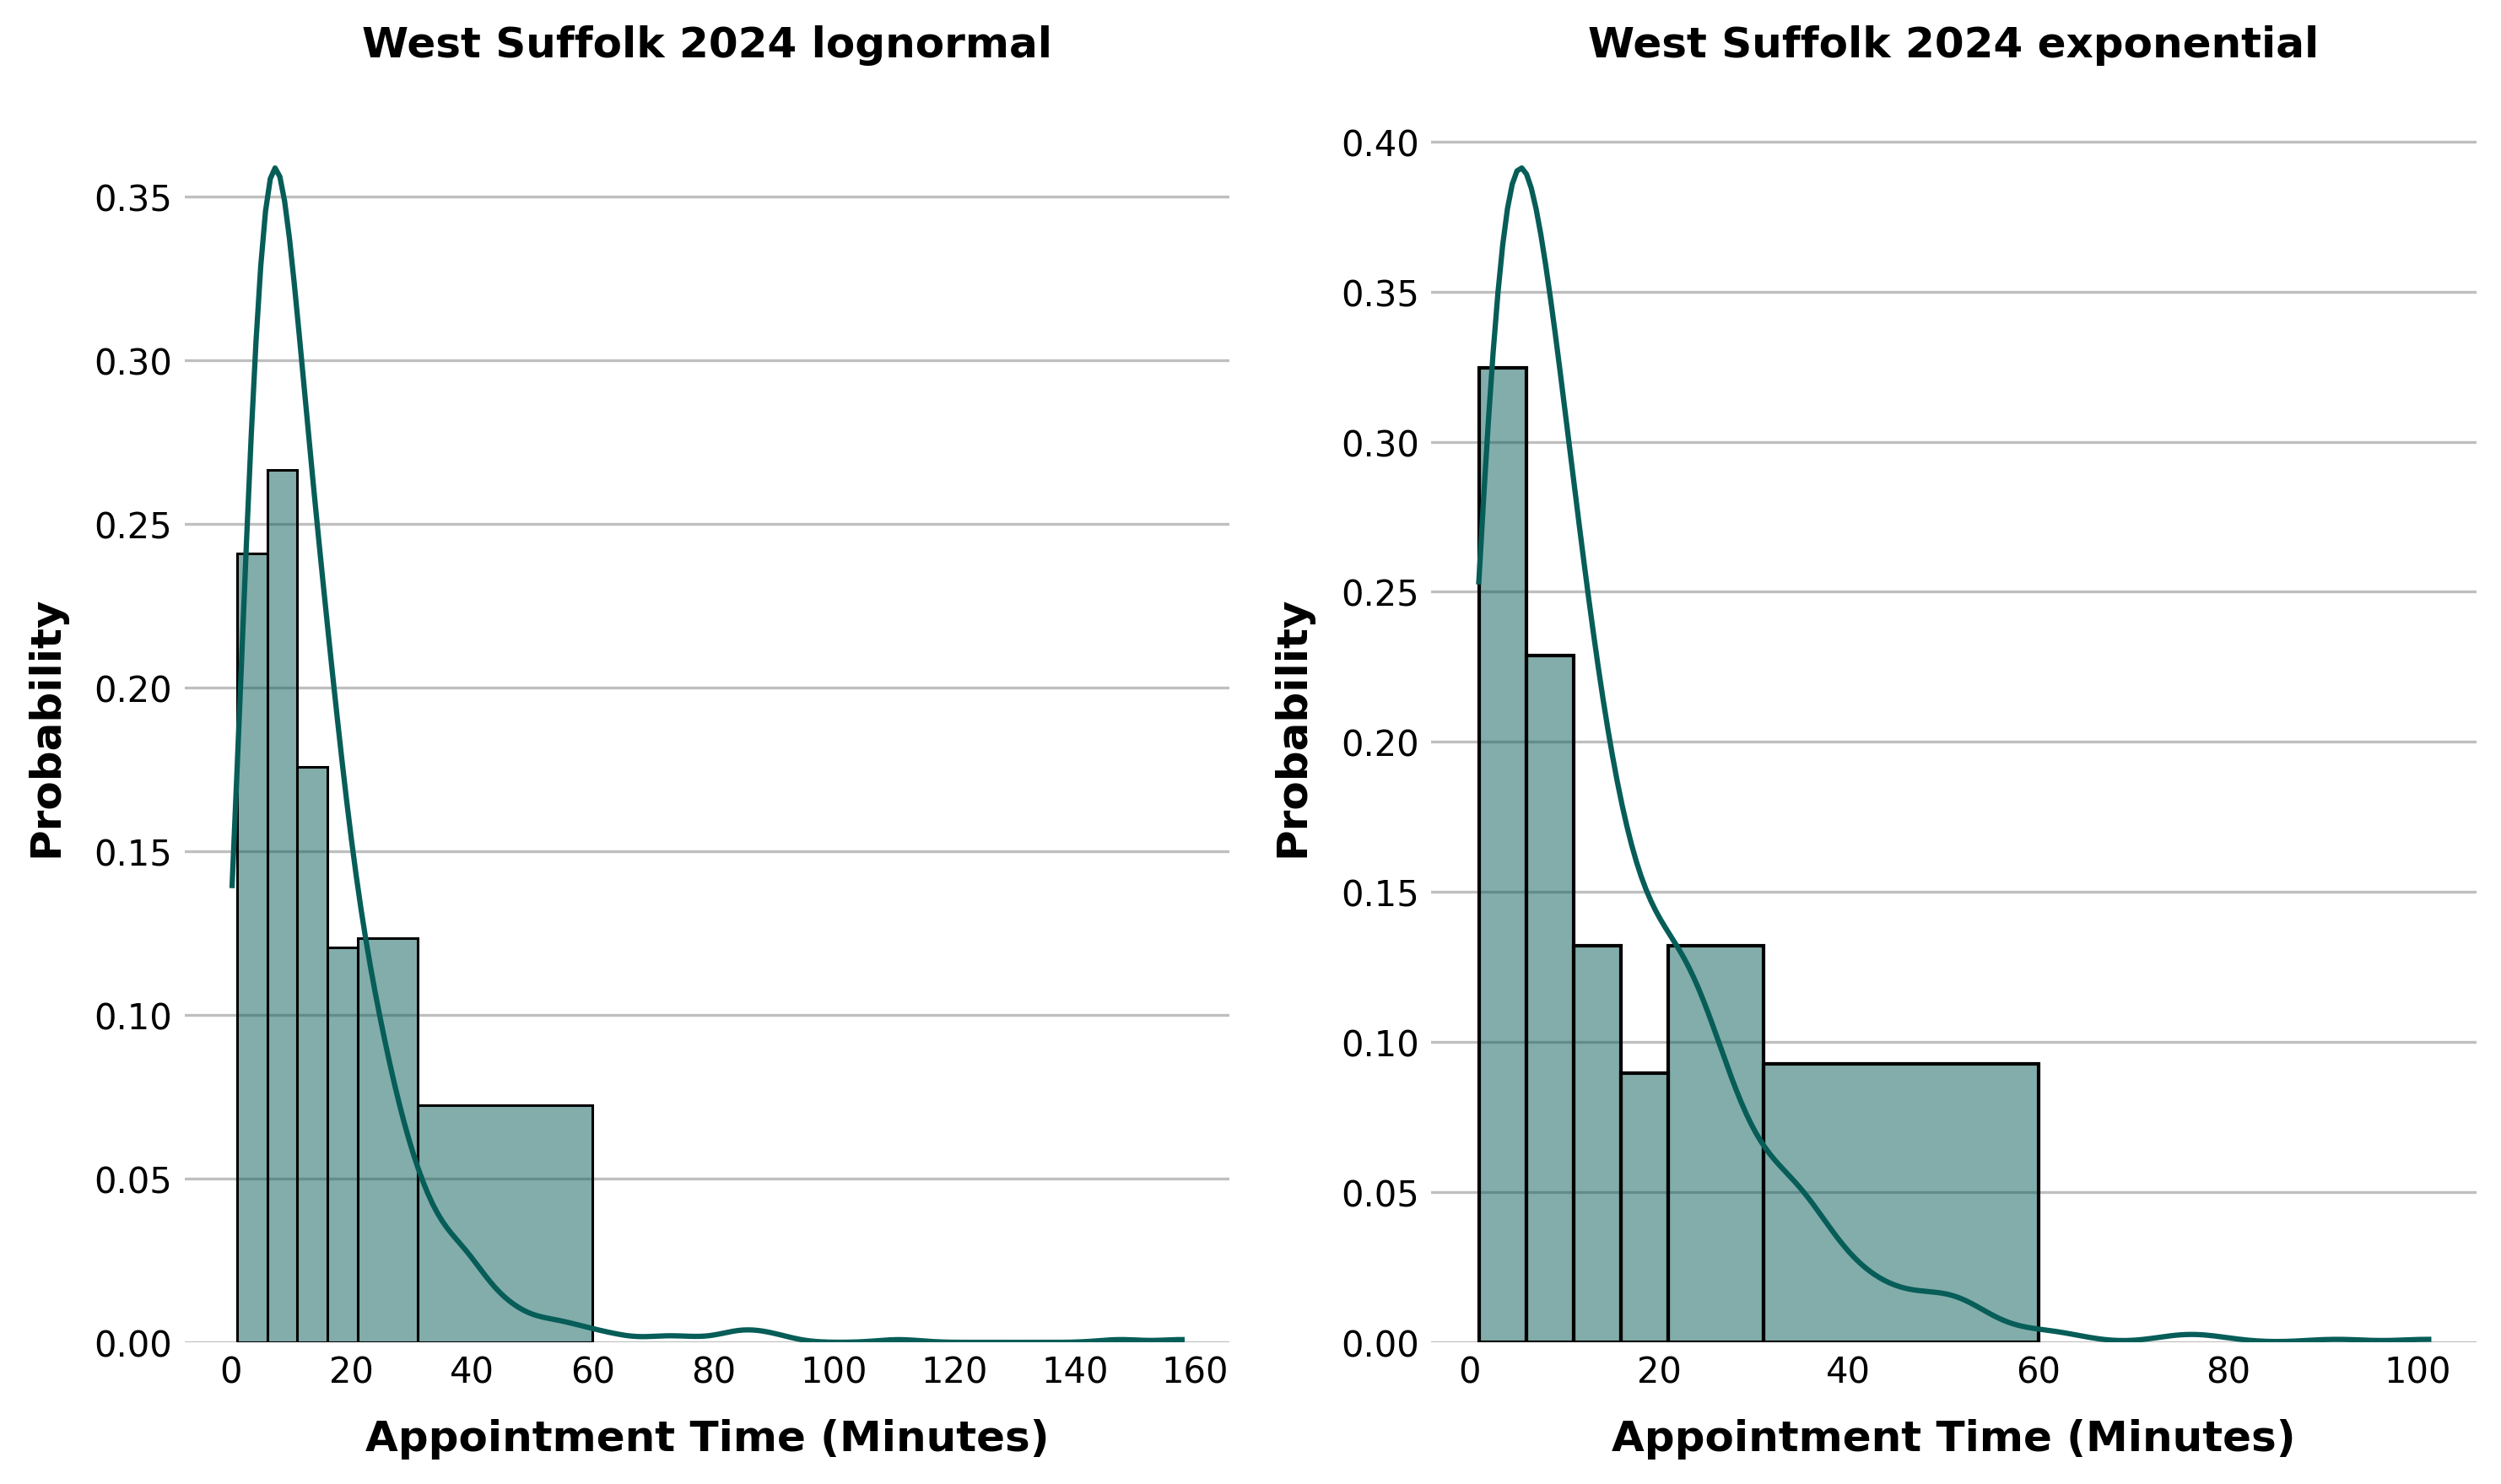
After examining the data, it was decided that FY2024 is probably the most 'normal' year representing more typical demand after COVID-19 disrupted the previous years, both in terms of appointment times and also formats.
Maximum Likelihood estimation
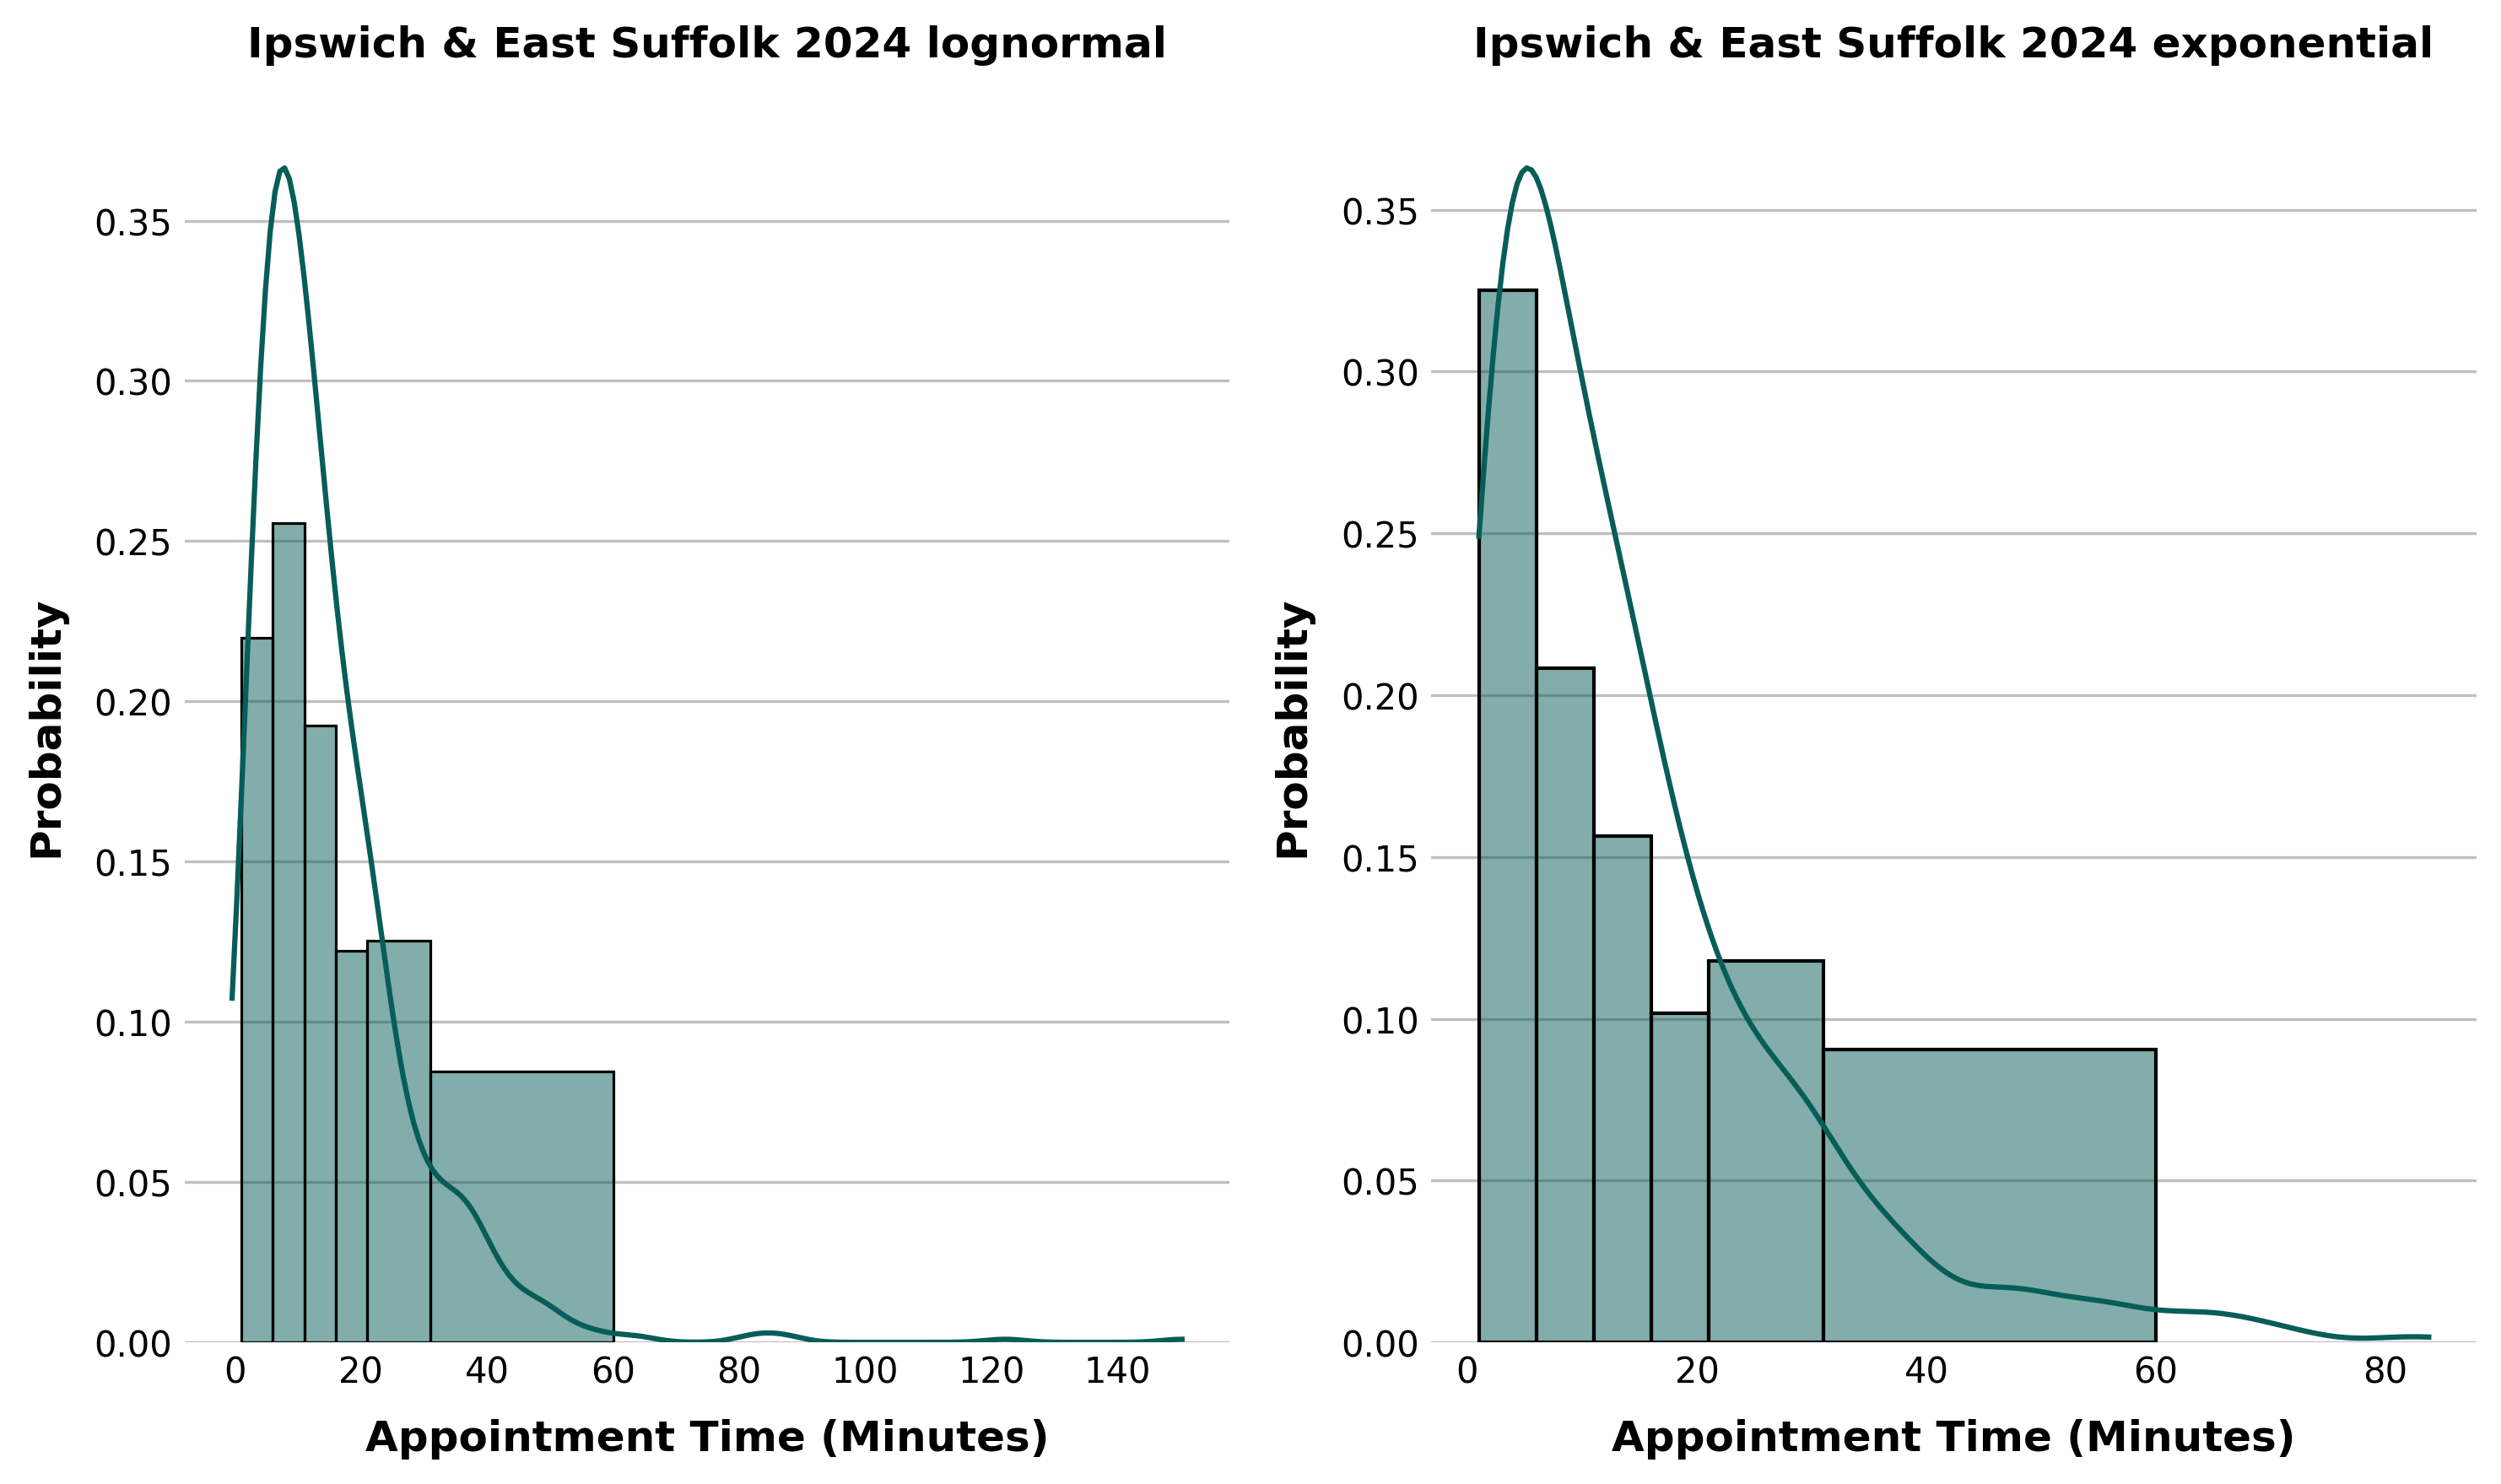
We used numpy arrays to linearly space the observations within the bin edges, then used scipy's built in fit method (using MLE) to determine the best parameters for each distribution using the FY2024 data.
Results
The results were a fitted set of distribution parameters which can be re-created during simulation runs. This is saved to a yaml file which is then easily read by the simulation application using a built in python package. These are positional arguments to scipy functions which recreate the distributions.
Ipswich & East Suffolk:
  expon:
  - 1.0
  - 13.335295514170516
  lognorm:
  - 0.7178872142941628
  - -1.3059899480227346
  - 12.221354792237264
North East Essex:
  expon:
  - 1.0
  - 13.167760538037228
  lognorm:
  - 0.6337657169020359
  - -2.0401683136291373
  - 13.320485301272308
West Suffolk:
  expon:
  - 1.0
  - 13.14423782677568
  lognorm:
  - 0.7037994624017062
  - -1.3999270911865338
  - 12.253406378839662